
Two families of tools
From the full decision-support platform
to the micro-application that saves you time
A project does not always need a platform. Sometimes it needs a single tool, which does one thing, very well. Here are the two families we develop.
Mega-application

TerrArgos
choose & decide
Predictive analytics and decision-support software for land and the environment, through large-scale data processing.
TerrArgos takes its name from Argos, the hundred-eyed giant of Greek mythology, able to see everything and let nothing slip. Joined to the Earth, the name sums up the tool's ambition: an exhaustive, watchful view of the land, where the human eye alone can cover neither the whole of a site nor the whole of its ecological cycles.
It is a geospatial decision-support platform for ecological assessments, audits and other ecological studies, as well as for environmental impact studies. It systematically cross-checks two independent statistical methods of species distribution modelling, each validated separately, to identify the areas where several methods agree — that is, the areas of reinforced confidence. For the selection of ecological offset sites, a dedicated comparative protocol, ACMEÉ, replaces undocumented expert judgement with a quantified method that can be replayed.
Every report is traceable and reproducible: processing version, data sources, computation parameters — everything is documented, so as to produce a deliverable that a third party can examine and replay. The offer is modular, from a rapid exploratory report through to a full regulatory audit, so that the level of methodological proof matches what is actually at stake in the project. We can compare sites and propose survey priorities, site by site. We assess the value of management options, ecologically and financially. And we can work on the eradication of invasive species, or on multi-species probabilities of presence.
| What the tool produces | In plain terms |
|---|---|
| Suitability | where habitat conditions suit the species |
| Transfers | where living things move through, and where that breaks down |
| Analyses | what the figures allow you to conclude, and what they rule out |
| Traceability | everything needed to repeat the computation identically in three years |
Download the brochure Brochure in French
PDF, 24 pages · 2.3 MB
What we are asked

Method & reliability
The questions ecologists and environmental consultancies ask before entrusting a case to anyone. The answers are direct, including on the limitations: a species distribution model has known, documented weak points, and a provider who does not name them probably does not deal with them.
What exactly does a probability-of-presence map represent?
The probability that habitat conditions suit the species, learned from known records and from a fine-grained description of the ground. It is not the probability of finding it on the day you go: a site may be suitable and empty, because the species never reached it, because the habitat has closed up since, or because a determining factor is not mapped. For a species strictly dependent on a host plant, a map that ignores the plant describes that plant's habitat: we say so, and the map is then presented as potential habitat.
How can you tell whether a map is reliable?
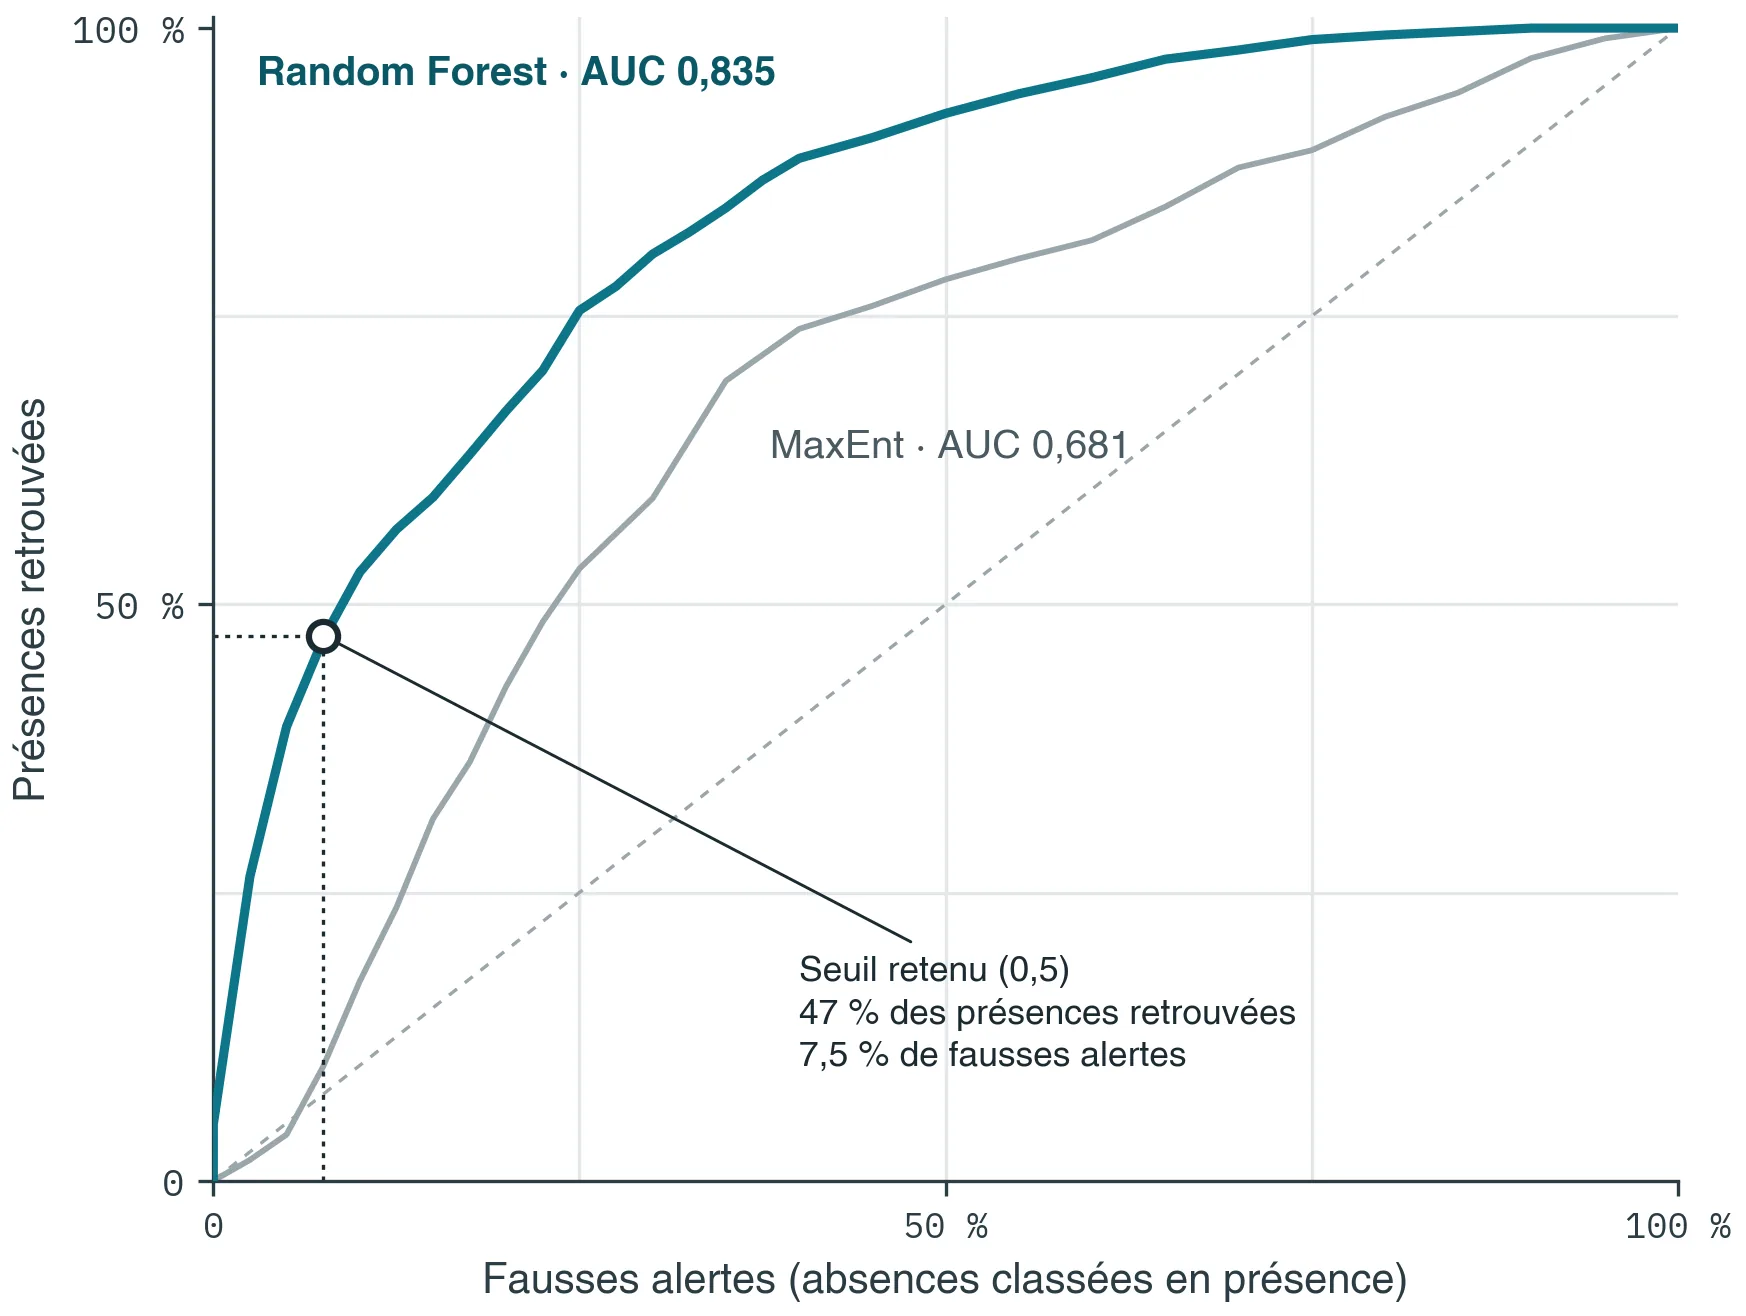
Three measures, never just one: ranking power, agreement beyond chance, and an index designed specifically for presence-only data. All three together, because they do not say the same thing. A model can rank very well and still be unusable — the order is right but the probability values mean nothing, and the map must then on no account be reclassified into high / medium / low.
Why are your scores sometimes lower than another provider's?
Because everything depends on how validation is done, and two figures obtained differently cannot be compared. Common practice sets aside a randomly drawn share of the records. But two records fifty metres apart resemble one another: the model is then scored on points it already knows, and the score rises without it predicting any better elsewhere. We withhold entire areas and score the model where it has seen nothing. The figure is lower, and it holds. Whoever your provider is, always ask how the validation was carried out.
Biological records are biased. How is that handled?
They are, and it is the first weakness of this kind of model. Records in public databases do not say where the species is: they say where naturalists went — trackside, known sites, designated areas. Without correction, the model partly learns the distribution of observers, and may give major importance to a variable that explains nothing. We draw our comparison points following the real survey effort, reconstructed from all the records available for the area.
How many records are needed? And for a rare species?
A few dozen at the very least; beyond about fifty, the model becomes markedly more robust. Below that, we say so before starting. For a rare species — the most frequent case, since the species at stake in a case are rarely abundant — there are two routes: widen the training set well beyond the study area, or give up on probability and deliver a suitable-habitat map, which does not claim the same thing. The choice made, and the reason for it, appear in the report.
Does a map replace a field survey?
Never, and we will not sell it as such. It targets the survey effort: where to go, at what time of year, what to concentrate the visits on. A species with a single annual generation and a short flight period is easily missed; absence is then concluded, wrongly. The model makes the survey more robust, it does not shorten it.
What is the result worth if the case is challenged?
Two things hold. The validation method, written beside every figure: a performance announced without saying how it was obtained cannot be defended. And traceability: every input is fingerprinted by a digital signature, and the report carries the full register. Three years later, you know which version of which layer produced which figure, and the computation can be repeated identically.
How can I check that it works on my own sites?
By a blind test, which we offer before any assignment. You choose a site you already know well and you do not send us your records. We build the model, we deliver the map, and only then do we compare. You read the success rate class by class, on your own ground.
Why is the detail of the method not published here?
What is public, and will stay public: the known limitations of this kind of model, the validation protocols, and the figures together with the method that produced them. That is what allows a piece of work to be judged. The full detail — variables retained, construction, parameters — is disclosed within an assignment or under a confidentiality agreement. And it is disclosed: a result the client cannot have checked by a third party is worth nothing the day it is challenged.
How much does it cost?
From €300 excl. VAT, depending on the level of proof your case requires — from a rapid exploratory assessment to a full regulatory audit. And on a good many other factors (species concerned, area to be studied, and so on).
Two services are priced individually: invasive species and the thirty-year trend.
In almost every case, the traceability manifest comes with the deliverable: the data used, the thresholds adopted, the limitations of the method, and what the figures do not allow you to conclude.
Micro-application

Edit, schedule
checked in a double click
Some needs do not call for a large project: just a precise tool that does one thing, very well, and makes your life easier. That is what we call micro-applications: programs developed to measure for one identified task, delivered ready to use — with no subscription, and no technical skill needed to use them day to day.
A concrete example:
monitoring calls for tender
A dedicated tool automatically retrieves the notices published in the Bulletin officiel des annonces des marchés publics, the French public procurement gazette, filters the results by the geographical area and the keywords that interest you, then produces a spreadsheet ready to read — formatting, columns and sorting already done. In one click.
Immediate time saved
The task leaves your working day altogether; it is not merely made shorter.
No technical skill required
The tool is used without knowing anything about what is inside it.
Adaptable
The principle applies to any repetitive, clearly identified task.